You have worked with one-way tables (even though you may not have called them by that name).
A one-way table is simply the data from a bar graph put into table form.
In a one-way table, you are only working with one categorical variable.
Two-Way Frequency Table: (displays "counts") |
Two way tables examine the relationships between two categorical variables, referred to as bivariate data. Two-way frequency tables are especially important because they are often used to analyze survey results. Two-way frequency tables are also called contingency tables.
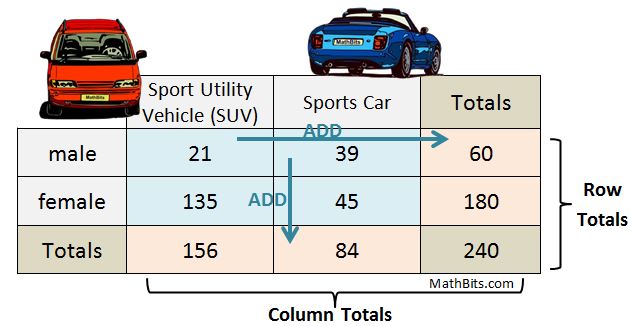
 The Basics of a Two-Way Frequency Table |
Two-way frequency tables are a visual representation of the possible relationships between two sets of categorical data.
• Categories are labeled at the top and the left side of the table.
• Frequency (count) information appears in the interior cells of the table.
•
"Totals" of each row appear at the right
• "Totals" of each column appear at the bottom. |
 Note: the "sum of the row totals" equals the "sum of the column totals".
(In the example below, notice the 240 seen in the lower right corner.)
This value (240) is the sum of all of the counts from the interior cells.
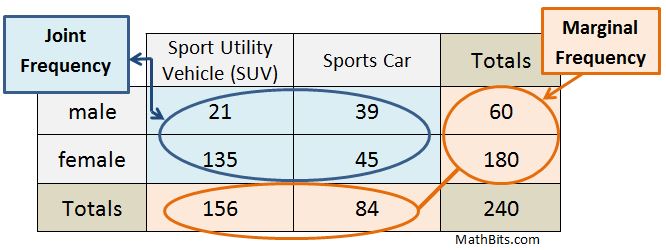
A survey asked, "If you could have a new vehicle, would you want a sport utility vehicle or a sports car?
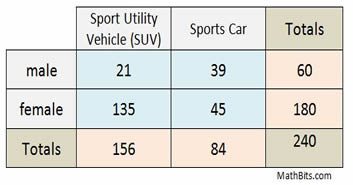
Vocabulary relating to the structure of a two-way frequency table:
| • joint frequencies - Entries in the body of the table (the blue cells where the initial counts appear) are called joint frequencies.
• marginal frequencies - The cells which contain the sum (the orange "Totals" cells) of the initial counts by row and by column are called marginal frequencies.
Note: the lower right corner cell (the total of all the counts) is not labeled as a marginal frequency. |
|
Take a look at the Sports Car column. This table shows 45 women chose Sports Car, while 39 men chose Sports Car.
Would this information answer the question, "In this survey, do more women or men prefer Sports Car? Not really! Read on to discover why this would be misleading information if interpreted in this manner.
|
|

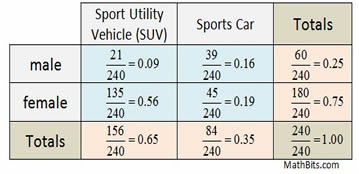
Two-Way Relative Frequency Table: (displays "percentages") |
When a two-way table displays percentages or ratios (called relative frequencies), instead of just frequency "counts", the table is referred to as a two-way relative frequency table.
Note: relative frequencies may be displayed as
•
a ratio,
•
a decimal (usually to nearest hundredth), or
•
a percentage (usually to nearest percent). |
Two-way tables can show "relative" frequencies in three ways:
(1) for the whole table (called a "relative frequency table"),
By placing certain "conditions" on the table:
(2) for rows (called a "conditional relative frequency table by row").
(3) for columns (called a "conditional relative frequency table by column"). |
(You may also see the terms "row conditional relative frequency" or "column conditional relative frequency").
To obtain a conditional relative frequency, divide a "joint frequency" (count inside the table) by a "marginal frequency" total (outer edge) that represents the condition being investigated (either row or column).
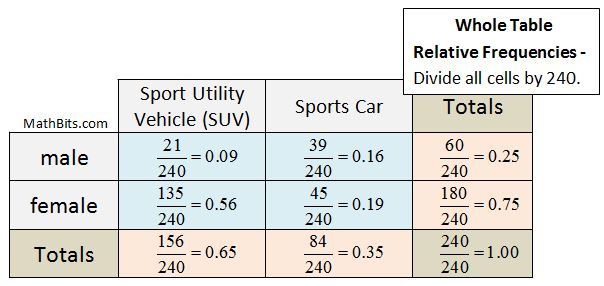
(1) Relative Frequency for Whole Table: |
|
|
If the two-way relative frequency is for the whole table,
each entry in the table is divided by the total count (found in the lower right corner).
The ratio of "1", or 100%, occurs only in the cell in the lower right corner.
Each of the main body cells (blue) is telling you the percentage of people surveyed
that gave that response (based upon the total number of people responding).
|
|
Under the Sports Car column, are we again seeing more women choosing a sports car than men (19% of the women and 16% of the men)??
Not really! Read on to discover why this can still be misleading information even when interpreted as a percentage.
|
|
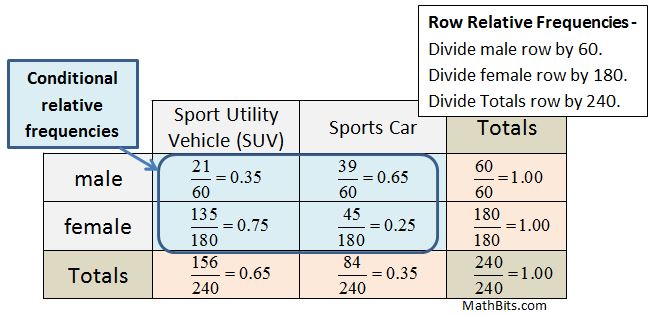
(2) Conditional Relative Frequency by Rows: |
|
|
If the two-way relative frequency is for rows,
the entries in each row of the table are divided by the total for that row in the table
(found on the right hand side of each row).
The ratio of "1", or 100%, occurs in all right hand "total" cells. |
This table is looking at women and men separately,
based upon how many women were surveyed, and how many men were surveyed.
Since male and female are "row" category headings, a "row" condition was used.
By choosing a row method, we are comparing men and women in relation to car type.
|
Do you see how this changes our previous interpretation of the data?
Using a row conditional relative frequency, we can see that 65% of the 60 men responding chose Sports Car, while only 25% of the 180 women responding chose Sports Car. This method takes into account the count of men and women separately, giving us a more realistic view of the relationship between the variables.
|
|
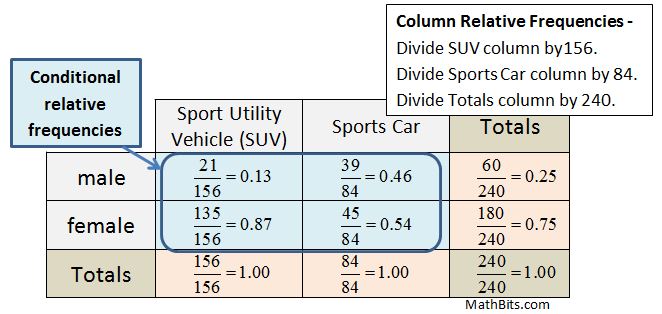
Conditional Relative Frequency by Columns: |
|
|
If the two-way relative frequency is for columns,
the entries in each column of the table are divided by the total for that column in the table
(found at the bottom of each column).
The ratio of "1", or 100%, occurs in all of the "total" cells at the bottom.
This table is looking at SUVs and Sports Cars separately,
based upon how many SUVs were chosen, and how many sports cars were chosen.
Since the vehicles are "column" category headings, a "column" condition was used.
By choosing a column method, we are comparing an SUV to a sports car in relation to gender choices registered.
|
|
So, what is this method showing us?
Are we back to more women than men choosing the Sports Car? The problem is that a column approach does not address the issue of which car men and women prefer.
In the column method, we are comparing an SUV to a sports car only in relation to gender responses. An appropriate question would be,
"Were SUVs or sports cars chosen more often by females?
|
|
In conclusion to our survey question:
Did women love sports cars more than men?
It is always possible that women may love sporty cars just as much, or more, than men. But this data did not support that notion. What needed to be considered in this problem was how many men and how many women responded to the survey, in order to answer our question.
To arrive at our answer, it was necessary to examine the table
by using a "conditional" situation based upon "rows".
What we have seen, by examining all of these tables, is that different tables answer different types of questions about the data. If you want to look for a relationship between the categorical variables, you will need to prepare a "conditional relative frequency table". You will then need to decide if a "row" method or a "column" method will address the situation you wish to examine.
What Two-Way Tables Tell Us: |
A variety of questions can be answered by examining a two-way frequency table.
Let's look at some possibilities:
Two-way frequency table
How many people responded to the survey? 240
How many males responded to the survey? 60
How many people chose an SUV? 156
How many females chose a sports car? 45
How many males chose an SUV? 21
|
Two-way relative frequency table
(whole table)
What percentage of the survey takers was female? 75%
What is the relative frequency of males choosing a sports car?
Was there a higher percentage of males or females
choosing an SUV?
higher percentage of females
|
Associations Based on Conditional Relative Frequency : |
An "association" exists between two categorical variables if the row (or column) conditional relative frequencies are different for the rows (or columns) of the table. The bigger the differences in the conditional relative frequencies, the stronger the association between the variables. If the conditional relative frequencies are nearly equal for all categories, there may be no association between the variables. Such variables are said to be independent.
In our Sports Car and SUV example (above), the row conditional relative frequencies showed a good degree of difference. Based upon that information, if we knew the gender of a survey respondent, we could make a good prediction as to whether he/she chose a sports car or an SUV. The statistical information is strong enough to support an "association" between gender and choice of vehicle. Now, this does not mean that there is always an association between gender and choice of vehicle. It just means that such an association is evident in the data from this survey.
|
Variables can be associated in many ways and to different degrees. Sometimes the best way to tell whether two variables are associated is to ask yourself whether they are not associated. Think backward.
In a two-way frequency table, if the relative frequencies for one variable are the same (or close) for all categories of another variable, there is no (or little) association.
|
|