|
Not all statements in mathematics involve dealing with equal quantities.
Sometimes, we may only know that something is "greater than" a certain value,
or "less than" another value.
These situations are referred to as inequalities (because they are not simply "equal").
You can think of an inequality as a statement that "compares" two values.
| Inequality Notations: (see other notation forms at Notations for Solutions) |
a > b ; a is strictly greater than b |
a  b ; a is greater than or equal to b |
a < b ; a is strictly less than b |
a  b ; a is less than or equal to b |
a ≠ b ; a is not equal to b |
Hint: The "open" (larger) part of the inequality symbol always faces the larger quantity. |
An expression such as "strictly greater than" means the value of a is greater than b, but cannot be equal to b.
Note: Reversal of an inequality: 2 < 4 can be "reversed" and written as 4 > 2.
x < 5 can be reversed to 5 > x and -2 > x can be reversed to x < -2
Notice that when the values "swapped sides", the direction of the inequality symbol flipped over.
| Graphing Inequalities on a Number Line |
|
|
|
When graphing a linear inequality on a number line, use an open circle for "less than" or "greater than", and a closed circle for "less than or equal to" or "greater than or equal to". |
To CHECK an inequality, it is not possible to test every value.
So check a value in each shaded region to see if it is TRUE.
You can also, check a value in each non-shaded region to see if it is FALSE.

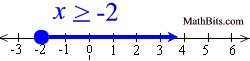
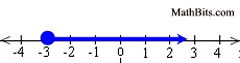
Graph the solution set of: x -3 |
The solution to this problem will be all values of x that are greater than, or equal to, -3. The solution will be all values that are graphed to the right of -3, including -3.
The graph will use a closed circle for -3 since x = -3 is among the solutions, with an arrow extending to the right. |
 CHECK:
A number in the shaded region = TRUE.
A number in the non-shaded area = FALSE.
Pick 0: 0 > -3 TRUE
Pick -4: -4 > -3 FALSE
The shaded arrow pointing right implies that the shaded arrow continues, without end, to the right. |
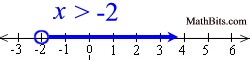
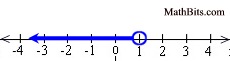
Graph the solution set of: x < 1 |
The solution to this problem will be all values of x that are only less than one (not equal to one).. The solution will be all values that are graphed to the left of 1, but not including one.
The graph will use an open circle for 1, to indicate that 1 is not included in the solution, and an arrow extending to the left. |
 CHECK:
A number in the shaded region = TRUE.
A number in the non-shaded area = FALSE.
Pick 0: 0 < 1 TRUE
Pick 3: 3 < 1 FALSE
The shaded arrow pointing left implies that the shaded arrow continues, without end, to the left. |
| "Phrases" Related to Inequalities: |
You will most likely run into the phrases listed below when working with inequalities.
These phrases may occur in problems that are asking you to create an inequality.
| "Phrases" and Inequalities: |
< |
> |
< |
> |
• less than
• fewer than
• below
• under
|
• greater than
• exceeds
• above
• more than
• over |
• less than or equal to
• maximum
• at most
• no more than
• no greater than
• does not exceed
• up to
• bottom
|
• greater than or equal to
• minimum
• at least
• no less than
• no fewer than
• no smaller than
• not below
• top |
| "Phrases" at work: |
"no greater than" |
x is no greater than 6
The biggest x can be is 6. |
x < 6 |
"at least" |
x is at least 19
The smallest x can be is 19. |
x > 19 |
"not below" |
x is not below 10
x can be 10 or bigger.
|
x > 10 |
| "not to exceed" |
x does not exceed 14
x is not bigger than 14. |
x < 14 |
| "at most" |
x is at most 33
The largest x can be is 33. |
x < 33 |
| "no less than" |
x is no less than 8
The x is not smaller than 8. |
x > 8 |
Write an inequality to represent:
"The value of x is under 12 dollars." |
Solution: x < 12 |
Write an inequality to represent:
"The minimum number of seats, s, available is 46." |
Solution: s > 46 |
Write an inequality to represent:
"Twelve is no greater than the sum of n and 4." |
Solution: 12 < n + 4 |
Write an inequality to represent:
"x exceeds the product of 3 and 9" |
Solution: x > 3 x 9
or x > 27 |
Write an inequality to represent:
"5 more than x is at least 6" |
Solution: x + 5 > 6
or 5 + x > 6 |
| "Determining" and "Evaluating" Inequalities: |
Questions may ask you to determine an inequality that best "fits" a described situation or a given set of data. Or, it may be the case that an inequality is given in a problem, and you must determine which values make the inequality true by substituting values into the given inequality.
A carpenter's cabinet contains various size clamps. The weight, in pounds, of each clamp in the cabinet is given: 2.3, 3.1, 2.7, and 3.5. Which inequality represents the weight, w, of any clamp in the cabinet?
A w > 2.3 B w < 2.4 C w > 3.5 D w < 3.6
Hint: Remember < is "less than" and > is "greater than".
Be sure the inequality will be "true" for ALL of the weights. |
|
Jennifer can spend $35 of her birthday money on jewelry. She wants to buy a bracelet, a necklace, and a pin. If the total cost of the bracelet and the necklace is more than $28, which inequality represents the dollar amount, d, she can spend on a pin?
A d > 7 B d < 7 C d > 63 D d < 63 |
|
Hint: If she spends exactly $28 of her $35, she will have $7 left to buy a pin. If she spends "more" than $28, she will have even less left to spend on a pin.
Which of the following inequalities would be graphed on a number line with an open circle at 3, and a shaded arrow to the left?
A x > 3 B x < 3 C x > 3 D x < 3 |
|
Hint: Remember that an open circle means that value will not be included. An arrow to the left means the values are getting smaller.
Given 2x - 1 < 5, which values from the set {0, 1, 2, 3, 4, 5} make the inequality true?
|
|
Hint:Substitute the values into the inequality, in place of x, to determine whether that value makes the inequality true..
2(0) - 1 < 5 gives -1 < 5 TRUE
2(1) - 1 < 5 gives 1 < 5 TRUE
2(2) - 1 < 5 gives 3 < 5 TRUE
2(3) - 1 < 5 gives 5 < 5 FALSE
2(4) - 1 < 5 gives 7 < 5 FALSE
2(5) - 1 < 5 gives 9 < 5 FALSE
Which set of value makes the inequality x > -6 true?
A {-6, -6,5, -7}
B {-5.9, -5.5, -4}
C {-7, 0, 6}
D {-7. -7. -8}
|
|
Hint: The values from the given sets can be substituted into the inequality. Remember that greater than -6 means values to the right of -6 on a number line.
|

NOTE: The re-posting of materials (in part or whole) from this site to the Internet
is copyright violation
and is not considered "fair use" for educators. Please read the "Terms of Use". |
|
|