|
|
A measure of center (or measure of central tendency) is a value that attempts to describe a set of data by identifying the central position of the set.
|
The most commonly used measures of center are the mean, median and mode.
While the mean and median are used to find the approximate "center" of a set of data,
the mode is used to find the most "popular"
value in the data set.
 Finding Measures of Center: Finding Measures of Center: |
Mean (or average):
|
Median (middle):
|
• is the number found by adding all of the values in the data set and dividing by the total number of values in that set (finding the average of the data set).
The mean is often thought of as the balance point of the data set.
Note: Do not round unless told to do so. Give full calculator result.
Note: mean = average
|
• is the middle number in an ordered data set.
The number of values that come before the median will be the same as the number of values that follow the median.
The median is a midpoint of the distribution.
To find the median:
1. Arrange the data into ascending (increasing) or descending (decreasing) order.
2. If the data has an odd number of values, the median is the middle value.
• If the data has an even number of values, the median is the average of the two middle values.
Note: Think of the "median on the highway", which is in the "middle" of the road.
|
Mode (most):
(least reliable indicator of central tendency) |
|
See how to use your graphing calculator with mean, mode, median
Click here. |
|
|
See how to use your graphing calculator with mean, mode, median and grouped data (frequency tables.)
Click here. |
|
|
• is the value in the data set that occurs most often.
When
data is presented in a frequency table form, the mode is the value with the highest frequency. In a histogram, the highest bar is the mode.
It is possible to have more than one mode.
If there is no repeated value in the set, there is no mode. Note: If there is no mode, be sure to write "no mode" and do not write zero (0).
* mode is most typically used with categorical data.
Note: mode = most |

|
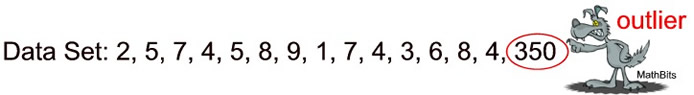
An outlier is an extreme value that differs greatly from the other values in the set.
|
|
| Which Measure of Center is the Best Choice? |
Each of the measures of center has "Pros" and "Cons".
|
"average" |
Use the mean to describe the most "typical" value of a set that does not have an outlier.
• most popular measure in business,
engineering and computer science.
• yields one distinct answer.
• useful for comparing sets of data. |
• yields inflated or deflated result when extreme values (outliers) are present. The mean has a tendency to be pulled toward extreme values. |
|
|
Use the median to describe the most "typical" value of a set that does have an outlier.
|
• outliers (extreme values)
do not affect the median as strongly as they affect the mean.
• yields one distinct answer.
• useful for comparing sets of data. |
• not as popular (or used as often) as the mean. |
|
|
Use the mode to describe the most "popular" value of a set.
|
• works with numeric and non-numeric data. Most used with non-numeric data.
• outliers (extreme values) do not affect the mode. |
• may not be one distinct answer - there may be more than one mode in a set (or no mode in a set).
• since there is the possibility of more than one answer, how do you decide which one best describes the central tendency?
• if no values in the set repeat, the mode is useless (as there is "no" mode).
• misleading as a central tendency if found far away from the rest of the data.
• not as popular as the mean or median. |
|
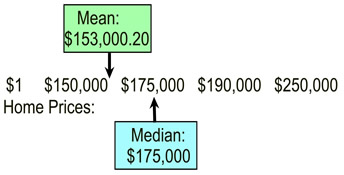
Notice what happens to the Mean and Median when an outlier appears:
|
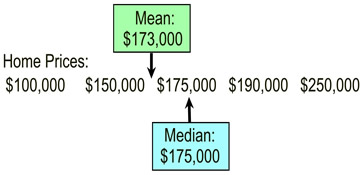
This graphic shows a listing of home prices arranged in ascending order. The mean and median are shown.
|
 This graphic is the same as the one on the left, except the lowest price has been replaced with an
 outlier . The $100,000 home has been "gifted" to a relative for $1. |
Conclusion: |
With the outlier, the mean changed.
With the outlier the median did not change. |
|
|
| If
All of the Data is Increased by (or Multiplied by) a Constant: |
| |
Data |
Mean |
Median |
Mode |
Original Data Set: |
3, 5, 7, 9, 10, 11, 13, 18, 18, 20 |
11.4 |
10.5 |
18 |
Add 5 to each data value |
8, 10, 12, 14, 15, 16, 18, 23, 23, 25 |
16.4 |
15.5 |
23 |
Added: When the same value (5) was added to each value, the same amount (5) was added to the mean, median and mode. Since all values shifted by the same amount, the central tendencies shifted by that same amount. |
Multiply 3 times each data value |
9, 15, 21, 27, 30, 33, 39, 54, 54, 60 |
34.2 |
31.5 |
54 |
Multiplied: When the same value (3) was multiplied times each value, the same amount (3) was multiplied times the central tendencies. |
Find the mean, median and mode for the following data: 29, 24, 31, 40, 30, 35, 25, 28
• First, put the data in ascending order: 24, 25, 28, 29, 30, 31, 35, 40
(ascending order is needed to find the median)
• Mean: 
• Median: 24, 25, 28, 29, 30, 31, 35, 40
With the data in ascending order, you can easily find the median.
Average the two middle numbers: ½ (29 + 30) = 29 ½
• Mode: Each number is listed only once, so there is no mode.
|
For what value of x will 8 and x have the same mean (average) as 27 and 5?
• First, find the mean of 27 and 5: (27+5) ÷ 2 = 16 (mean)
• Now, find the x value, knowing that the average of x and 8 must be 16:
(x + 8 ) ÷ 2 = 16
x + 8 = 32
x = 24
|
Alison scored 86, 77, 92, 72, and 63 on her first five Social Studies tests. What test score must she earn on her sixth text to obtain an average (a mean score) of 80 over the six tests?
• First, set up an equation to represent this situation. Let x = the score she needs.
(86 + 77 + 92 + 72 + 63 + x) ÷ 6 = 80
• Now, find the x value:
(86 + 77 + 92 + 72 + 63 + x) ÷ 6 = 80
390 + x = 80 × 6
390 + x = 480
x = 90 Allison will need to score 90 on the sixth test to get an average of 80.
|

NOTE: The re-posting of materials (in part or whole) from this site to the Internet
is copyright violation
and is not considered "fair use" for educators. Please read the "Terms of Use". |
|