|
Directions: Read carefully and choose the best answers.
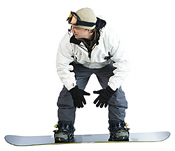
1. The number of snowboarding accidents reported weekly during one winter season at the Fun Mountain Resort:
12, 15, 6, 8, 12, 17, 10, 8, 7, 13, 14, 16, 8, 18, 11 |
 |
(b) Find the median.
(c) Find the mode.
(d) A teenager wants to emphasize the safety of snowboarding. Which measure of central tendency should the teen use?
(e) A parent wants to emphasize the dangers of snowboarding. Which measure of central tendency should the parent use?
|
|
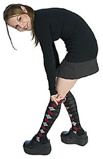
2. A company is releasing two new types of knee socks: argyle and plaid. The table below shows the sales numbers for the first week.
Day of Week |
Mon |
Tues |
Wed |
Thurs |
Fri |
Sat |
Sun |
Argyle |
8 |
10 |
1 |
10 |
2 |
10 |
1 |
Plaid |
14 |
6 |
8 |
6 |
18 |
12 |
6 |
|
|
(a) Find the mean, median and mode of the argyle knee socks sales.
(b) Find the mean, median and mode of the plaid knee socks sales.
(c)Which measure of central tendency would you use to show that the argyle knee socks are selling better?
(d)Which measure of central tendency would you use to show that the plaid knee socks are selling better?
(e)Which measure of central tendency would you use to show that there is no difference between the sales of the two types of knee socks?
(f) Which knee socks sales had the larger spread of sales?
|
|
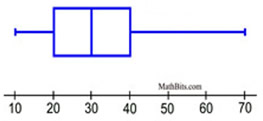
3. The box plot shown at the right is described as being a ____________.
|
 |
|
|
4. Compare mean and median in differently shaped data distributions. For each type of distribution stated below, decide what is "typically" the relationship between the mean and the median. |
Type of distribution: |
mean larger |
median larger |
mean = median |
|
symmetric, bell-shaped distribution |
|
distribution skewed right |
|
distribution skewed left |
|
uniform distribution |
|
|
|
5. The best measure of center to use when data is skewed is the ____________.
|
 |
|
|
6. Which of the following statements is false?
|
|

NOTE: The re-posting of materials (in part or whole) from this site to the Internet
is copyright violation
and is not considered "fair use" for educators. Please read the "Terms of Use". |
|