We saw that it is possible to use different
shaped functions (curves) to model data. Choosing which curve to use (linear, quadratic, exponential) was easy as long as the scatter plot showed a resemblence to the actual curve. But what if it is unclear as to which curve to choose?
Residuals help to determine if a curve (shape) is appropriate for the data.
(linear versus non-linear)
|
A residual is the difference between what is plotted in your scatter plot at a specific point, and what the regression equation predicts "should be plotted" at this specific point. If the scatter plot and the regression equation "agree" on a y-value (no difference), the residual will be zero.
|
Residual = Observed y-value - Predicted y-value
|
A residual is the difference between the observed y-value (from scatter plot) and the predicted y-value (from regression equation line).
It is the vertical distance from the actual plotted point to the point on the regression line.
You can think of a residual as how far the data "fall" from the regression line
(sometimes referred to as "observed error"). |
|
Linear associations are the most popular statistical relationships since they are easy to read and interpret. We will spend the majority of our time working with linear relationships, and residuals can tell us when we have an appropriate linear model.
When you look at your scatter plot, and you are unsure if the shape (curve) you chose for your regression equation will create the best model, a residual plot will help you make a decision as to whether the model you chose will, or will not, be an appropriate linear model.
A residual plot is a scatter plot that shows the residuals on the vertical axis and the independent variable on the horizontal axis. The plot will help you to decide on whether a linear model is appropriate for your data.
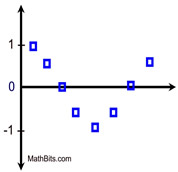
| Appropriate linear model: when plots are randomly placed, above and below x-axis (y = 0). |
| Appropriate non-linear model: when plots follow a pattern, resembling a curve. |
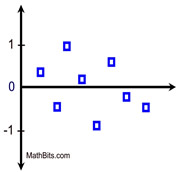 Random, No Pattern
"Linear Appropriate"
|
 U-shaped Pattern
"Non-Linear Appropriate"
|
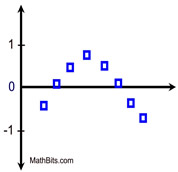 Inverted U-shaped Pattern
"Non-Linear Appropriate"
|
When a pattern is observed in a residual plot,
a linear regression model is probably not appropriate for your data. |
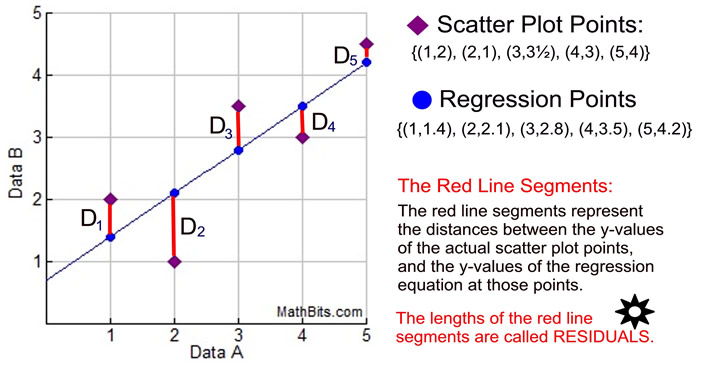
You are asked to find an equation to model the data in the set {(1,2), (2,1), (3,3½), (4,3), (5,4½)}.
You prepare a scatter plot to see if you should be looking for a linear, quadratic or exponential regression equation. You decide to choose a linear regression, but you are not 100% sure of your choice.
You use your graphing calculator to find the linear regression equation, which is y = 0.7x + 0.7.
You graph the regression equation line on the scatter plot, as seen below. |
 |
The
residuals are the
red line segments, referenced by the letter "D" (for distance), vertically connecting the scatter plot points to the corrdinating points on the linear regression line.
You decide to plot the residuals to see if your choice of a linear regression model was appropriate for your data.
First, you must find the residuals.
Compute: scatter plot y-value minus regression line y-value for each point.
|
D1 = 2 - 1.4 = 0.6
D2 = 1 - 2.1 = -1.1
D3 = 3.5 - 2.8 = 0.7
D4 = 3 - 3.5 = -0.5
D5 = 4.5 - 4.2 = 0.3
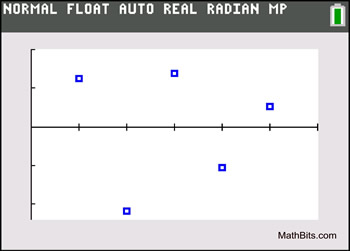
Now, plot the residuals.
(1,0.6), (2,-1.1), (3,0.7), (4,-0.5), (5,0.3)
As you examine the plots, you notice that the plots do not follow any pattern. |
|
| The plots are randomly placed above and below the horizontal axis. A linear model is an appropriate choice for this data. |
|
Did you notice that the red line segments in the graph (the residuals) fall above and below the regression line. This means that a residual may be a positive value, a negative value, or zero.
|
|
When prepared using a graphing calculator, with the "best fitting regression line":
* The sum of the residuals is equal to zero. [.6+(-1.1)+.7+(-.5)+.3=0]
* The mean (average) of the residuals is equal to zero. [0/5 = 0]

Residuals were the basis of the statistically agreed upon definition
of a "best fitting line (or curve)".
Agreed upon definition: A best-fitting curve (of any shape) will be the curve which has the smallest sum of the squares of the residuals.
D12 + D22 + ... + Dn2 will be a minimum. |
A curve having this property, where the square of the vertical distances from the data points to the curve are as small as possible, is called a least-squares curve.
Remember:
Least-Squares Regression Line = Regression Line of "Best" Fit |
Residuals on the Graphing Calculator:
When regression models are computed on the graphing calculator, residuals are automatically stored in a list called RESID. Follow the links below to see how to work with residuals on your calculator.
|
|
|