Continuous
|
|
Definition: A set of data is said to be continuous if the values belonging to the set can take on ANY value within a finite or infinite interval. |
Definition: A set of data is said to be discrete if the values belonging to the set are distinct and separate (unconnected values). |
Examples:
•
The height of a horse (could be any value within the range of horse heights).
• Time to complete a task (which could be measured to fractions of seconds).
• The outdoor temperature at noon (any value within possible temperatures ranges.)
• The speed of a car on Route 3 (assuming legal speed limits). |
Examples:
•
The number of people in your class (no fractional parts of a person).
• The number of TV sets in a home (no fractional parts of a TV set).
• The number of puppies in a liter (no fractional puppies).
• The number of questions on a math test (no incomplete questions). |
NOTE: Continuous data usually requires a measuring device. (Ruler, stop watch, thermometer, speedometer, etc.) |
NOTE: Discrete data is counted. The description of the task is usually preceded by the words "number of...". |
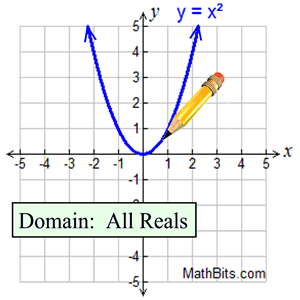
Function: In the graph of a continuous function, the points are connected with a continuous line, since every point has meaning to the original problem. |
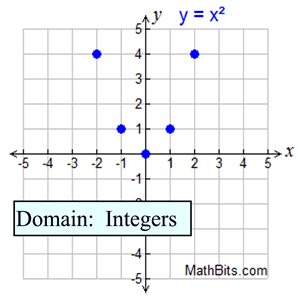
Function: In the graph of a discrete function, only separate, distinct points are plotted, and only these points have meaning to the original problem. |
Graph: You can draw a continuous function without lifting your pencil from your paper.

|
Graph: A discrete graph is a series of unconnected points (a scatter plot).

|
Domain: a set of input values consisting of all numbers in an interval. |
Domain: a set of input values consisting of only certain numbers in an interval. |
In Plain English: A continuous function allows the x-values to be ANY points in the interval, including fractions, decimals, and irrational values. |
In Plain English: A discrete function allows the x-values to be only certain points in the interval, usually only integers or whole numbers. |
Why do we care? When graphing a function, especially one related to a real-world situation, it is important to choose an appropriate domain (x-values) for the graph. For example, if a function represents the number of people left on an island at the end of each week in the Survivor Game, an appropriate domain would be positive integers. Hopefully, half of a person is not an appropriate answer for any of the weeks. The graph of the people remaining on the island would be a discrete graph, not a continuous graph. |


