|

|
A polynomial function is a function which is defined by a polynomial expression.
Examples: f(x) = x2 + x - 6; P(x) = x3 - x2 - 12x; y1 = x2 + 4x + 4 |
First, let's review some information about polynomial graphs from Algebra 1.
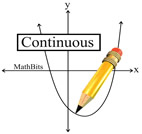
| Continuous: The graphs of polynomial functions are continuous. You can draw the entire function without lifting your pencil from your paper. |
 |
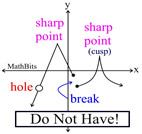
Smooth: The graphs of polynomial functions are always nice smooth graphs. The graphs do not contain holes, breaks or sharp point corners.
|
 |
 |
"Turning Points" |
A "turning point" on a graph is a point at which the graph changes from increasing to decreasing (it looks like a "hill"), or from decreasing to increasing (it looks like a "valley").
 The number of turning points is never more than The number of turning points is never more than
the degree of the polynomial minus one.
For example, the graph of a 3rd degree polynomial function can have 2 turning points or fewer. [If the degree is n, the number of turning points is at most n - 1. There could be fewer.] |
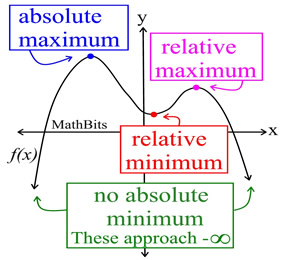 |
These turning points are referred to as relative (or local) maxima or minima. The designation of "relative" (or "local") tells you that this point may not be the largest (or smallest) value reached by this function. It is only a maximum (or minimum) "relative" to a small interval of the function surrounding this point. The one, true, largest (or smallest) value reached by the entire function is called the absolute maximum (or minimum), or the global maximum (or minimum).
There is some disagreement among textbook authors as to whether a relative maximum (or minimum) can occur at an endpoint (on a closed interval). Some references say "a relative max/min must occur in an open interval within the domain" (not at an endpoint), while others say "a relative max/min may occur at an endpoint." Some texts even introduce the terminology "endpoint maxima/minima" to avoid this issue. Note: An "absolute" maximum (or minimum) can occur at an endpoint.
A relative maximum may also be an absolute maximum. In the graph shown above, the absolute maximum is also a relative maximum.
The plural of maximum is maxima,
and the plural of minimum is minima.
Such references fall under the category of "extrema". |
|
|
For calculator
help with
maximum and minimum
click here.
|
|
|
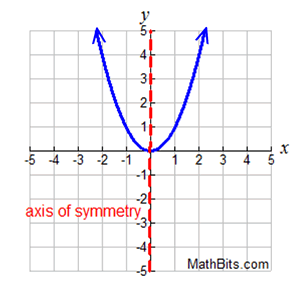
We have seen that the graph of a parabola is a symmetric graph. The graph has an axis of symmetry over which the graph becomes a reflection (or mirror image) of itself.
We saw, when graphing parabolas, that knowing one portion of the graph let us quickly know how to graph its symmetric portion as well.
Not all graphs have symmetry. Of those functions that do possess symmetry, there are two types of symmetries that are popular: vertical symmetry and symmetry about the origin. |
|
If a graph possesses horizontal symmetry (such as a reflection over the x-axis), the graph is not a function.
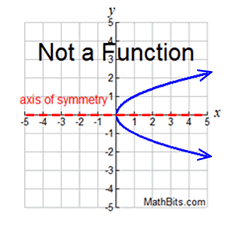
possesses both (x,y) and (x,-y).
|
A function graph may possess vertical symmetry (such as a reflection over the y-axis).
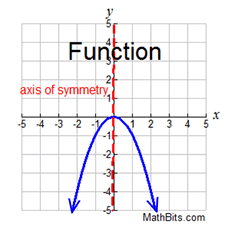
possesses both (x,y) and (-x,y).
|
A function graph may possess symmetry about the origin (0,0).
This is the same as a rotation of 180º
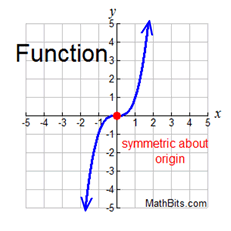
possesses both (x,y) and (-x,-y).
|
FYI: If a function is symmetric with respect to the y-axis (a reflection over the y-axis), it is called an even function.
If a function is symmetric with respect to the origin (a rotation of 180 degrees about the origin), it is called an odd function. NOT "all" functions are even function or odd functions.

 |
End behavior refers to the appearance of a graph as it is followed farther and farther in either direction (as the x-value gets very large or very small).
|
We have seen graphs with an arrow on either (or both) ends of the function indicating that the function continues "in the same manner" as the x-values continue to increase or decrease.
In the graph at the right, the arrow on the right end of the function tells us that as the x-values get larger and larger, the function (the y-values) will also get larger and larger. We say: "as x approaches positive infinity, f (x) approaches positive infinity."
And we write:
The arrow on the left end of this function says, as the x-values get smaller and smaller, the function will get smaller and smaller. We say: "as x approachers negative infinity, f (x) approaches negative infinity."
And we write:  . . |
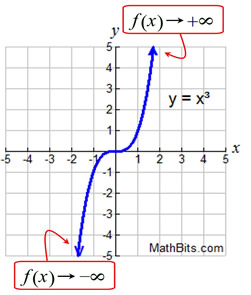 The arrow (→) is read "approaches".
 |
Other possibilities:
|
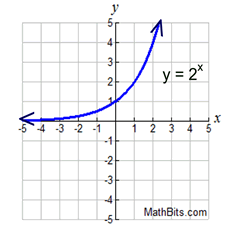
Right end approaching + infinity.
Left end approaching zero.


|
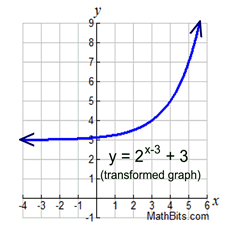
Right end approaching + infinity.
Left end approaching three.


|
Special End Behavior Information for Polynomial Functions:
Polynomial functions have some special characteristics regarding end behavior, based upon whether the DEGREE of the
polynomial is an odd or even number, and whether the SIGN of the leading coefficient is positive or negative. You can predict the end behavior of these functions without looking at the graph.
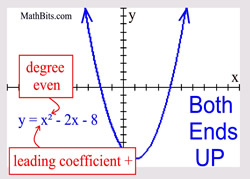
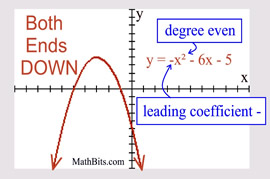
Even Degree Polynomial
("ends" behave similar to a quadratic) |
 Leading coefficient POSITIVE: Leading coefficient POSITIVE:
Both "ends" are UP.
 Leading coefficient NEGATIVE: Leading coefficient NEGATIVE:
Both "ends" are DOWN.
|
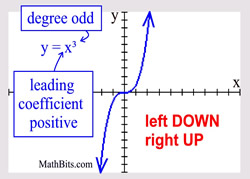
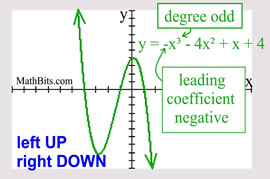
Odd Degree Polynomial
("ends" behave similar to a cubic) |
 Leading coefficient POSITIVE: Leading coefficient POSITIVE:
Left end is DOWN and right end is UP.
 Leading coefficient NEGATIVE: Leading coefficient NEGATIVE:
Left end is UP and right end is DOWN.
|
|
For calculator
help with
determining
end behavior
click here.
|
|

NOTE: The re-posting of materials (in part or whole) from this site to the Internet
is copyright violation
and is not considered "fair use" for educators. Please read the "Terms of Use". |
|

