As a reference see: "What Do Linear Quadratic Systems Look Like?"
A linear quadratic system is a system containing one linear equation and one quadratic equation
which may be one straight line and one parabola,
or one straight line and one circle.
 Graphical Solutions Graphical Solutions |
|
straight line: y = mx + b
parabola: y = ax2 + bx + c; a ≠ 0
circle: (x - h)2 + (y - k)2 = r2 ; center (h.k), radius r |

Solve this linear-quadratic system of equations graphically and check your solution:
|
y = x2- 6x + 3 (parabola)
y = -2x + 3 (straight line)
|
Whether you graph the "line" first or the "parabola" first is not important.
This example will graph the parabola first.
It will be helpful to set the equations equal to y, if not already done. |
1. Graph the parabola (y = x2 - 6x + 3).
Find the axis of symmetry (where the turning point of the parabola will occur) to help set up the x-values for the table of values.
|
To find the axis of symmetry,
use the formula x = -b/2a.
In this example, a = 1, b = -6 and c = 3.
x = -b/2a
x = -(-6)/2(1)
x = 3 (axis of symmetry)
|
2. Use this x-coordinate of the turning point as the middle value of your table of values.
• Find the y-coordinate of the turning point by substituting x = 3 into the parabola's equation:
y = x2- 6x + 3
y = (3)2 - 6(3) + 3
y = 9 - 18 + 3 = -6 Turning point: (3,-6)
• Choose at least 1 x-value greater than, and at least 1 x-value less than the turning point x-value of 3.
• Substitute these x-values into the parabola's equation to find the corresponding y-values. |
x |
y |
-1 |
10 |
0 |
3 |
3 |
-6 |
4 |
-5 |
5 |
-2 |
|
| 3. Graph the parabola from the table of values. |
 |
|
4. Graph the line ( y = -2x + 3).
Graph the line on the same set of axes.
Remember that y = mx + b where m is the slope and b is the y-intercept.
In this example,
y = -2x + 3 means the slope is -2 (rise over run), and the y-intercept is 3.
Be sure to use a straight-edge to draw the line. It will help you identify where the graphs actually cross.
|
|
5. Find the intersection points (where the graphs cross).
This will be the solution set. As seen on the graph, the intersection points occur at (0,3) and (4,-5).
The solutions may be stated as the set {(0, 3), (4, -5)}. |
6. CHECK: When graphing, it may "appear" that the graphs are intersecting at easy-to-read points, when in reality the intersections may be slightly "off" from those easy to read points. The possibility of such a visual mis-read makes it imperative that you check your intersection points.
CHECK (0,3):
y = x2- 6x + 3
3 = 0² - 6(0) + 3
3 = 3
(check)
y = -2x + 3
3 = -2(0) + 3
3 = 3 (check) |
CHECK (4,-5):
y = x2- 6x + 3
-5 = 4² - 6(4) + 3
-5 = 16 - 24 + 3 = -5 (check)
y = -2x + 3
-5 = -2(4) + 3
-5 = -8 + 3 = -5 (check) |
|

Solve this linear-quadratic system of equations graphically and check your solution: |
x2 + y2 = 1 (circle)
2y = x + 1 (straight line) |
1. Analyze the graph of the circle ( x2 + y2 = 1).
The form of the equation tells us that this circle has its center at the origin and the radius is the square root of 1, which is 1.
|
Center at the origin.
Radius = 1. |
2. Graph the circle.
 |
|
3. Graph the line ( 2y = x + 1).
Graph the line on the same set of axes.
Remember that y = mx + b where m is the slope and b is the y-intercept.
In this example, 2y = x + 1 (which is really y = ½x + ½) means the slope is ½ (rise over run), and the y-intercept is ½.
Be sure to use a straight-edge to draw the line.
|
|
4. Find the intersection points (where the graphs cross).
This will be the solution set. As seen on the graph, one of the intersection points appears to be (-1,0), but it is unclear what the coordinates of the second intersection point may be. If this occurs, you will have to resort to an algebraic solution to find that second intersection point.
At this point, we will state the solutions as the set {(-1, 0), (?, ?)}, until we find the second intersection point. |
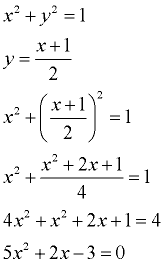
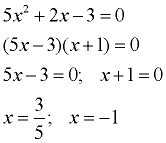
5. An algebraic solution is needed to find the second intersection point.
 |

Our algebraic solution shows us that the second intersection point will be (3/5, ?).
And it also verifies that our first intersection point is actually (-1,0). |
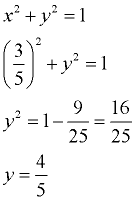
Find the missing y-coordinate.

We know that the coordinate is in the first quadrant, so we only need to consider the positive value of 4/5.
|
| We now know that the solution set is {(-1, 0), (3/5, 4/5)}. |
|
6. CHECK:
CHECK (-1,0):
x2 + y2 = 1
(-1)² + 0² = 1
1 = 1 (check)
2y = x + 1
2(0) = -1 + 1
0 = 0 (check) |
CHECK (3/5,4/5):
x2 + y2 = 1
(3/5)² + (4/5)²= 1
9/25 + 16/25 = 1
1 = 1 (check)
2y = x + 1
2(4/5) = 3/5 + 1
8/5 = 8/5 (check) |
|
|