Practice Page
Directions: Read carefully!

1. Carlos thinks he has discovered a new variation of monarch butterflies. The new butterflies have a different coloring pattern and they appear to be larger than the traditional monarch butterfly. He collects four of his new butterflies and four traditional butterflies, measures their wingspans, and releases the butterflies. mbutterflies
Of the 8 butterflies collected, Carlos observed that the difference between the mean of the wingspans of his four new butterflies and the mean of the wingspans of the four traditional butterflies was 0.5 cm. The dot plot below shows the randomization distribution of 70 re-samples of Carlos' data with a scale of 0.1 cm.
comparemath1n

comparediffgraph

Carlos is hoping that he has made a significant discovery. Use the given information and the Randomization Test with a 95% confidence level to determine whether the mean difference discovered by Carlos was of statistical significance, or whether it occurred by chance. Use calculations and explanations to support your decision.


2. Situation: Finger tap rates with and without caffeine
Subjects: 20 male college students randomly divided into two groups of 10 in each group
Treatment: Each group drank two cups of coffee. One group was drinking coffee with 200 mg caffeine. The other group was drinking decaffeinated coffee.
Measurement: After two hours each student was
coffee
tested to measure finger tapping rates (taps per minute).
Null Hypothesis:
Caffeine does not produce an increase in the average tap rate.
Alternative Hypothesis:
Caffeine produces an increase in the average tap rate.
Confidence Level: 95%
Hypothesis Method: Randomization Test
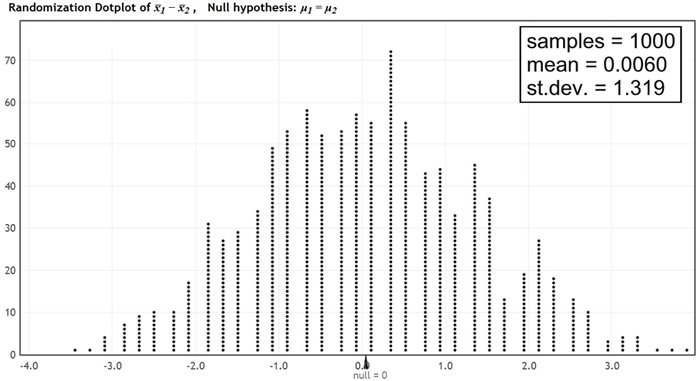
A Randomization Test on this data would require 20C10 = 184,756 re-samples.
A computer program will be used to model the randomization distribution for 1000 re-samples to give us approximate findings.
(Dot plot from lock5stat.com applet.)
randomizationgraph2

Observed data:
Caffeine (taps/min)
245
246
246
248
248
248
250
250
250
252
No Caffeine
242
242
242
244
244
245
246
247
248
248

a)
What are the means of the taps per minute for the two groups?
(caffeine group, no caffeine group)

Choose:
(248.3, 244.8)
(249.4, 246.2)
(248.8, 246.1)
(247.9, 245.0)

b) What is the difference of the means of the taps per minute for the observed data ("caffeine group - no caffeine group")?
Choose:
2.7
2.9
3.2
3.5

c)
Using the information presented in this scenario, determine whether there is statistical significance in the difference of the means relating to taps per minute observed in this study. Justify your answer.


3. Bamboo is becoming an increasingly popular home construction product due to the fast growing nature of the bamboo plant. The yearly growth of one year old bamboo plants was studied under two conditions. The mean growth heights of one hundred plants grown in an outdoor field and one hundred plants grown in an indoor facility over one year is shown below.
Outdoor Group
Indoor Group
Mean = 86.9 inches
Mean = 97.2 inches

A Randomization Test is undertaken. Due to the large sample sizes, a computer is used to simulate a distribution of the differences in the mean heights. The results of 2930 simulated re-samples are reported in the histogram shown below.

randomgraph3

a) Determine the mean difference in the growth heights using "Outdoor Group - Indoor Group" and explain its meaning in the context of this problem.

b) Using the information provided, determine if the observed mean difference in the growth heights was of statistical significance. Explain.


divider

NOTE: The re-posting of materials (in part or whole) from this site to the Internet is copyright violation
and is not considered "fair use" for educators. Please read the "Terms of Use".