|
Directions: Read carefully!
1. |
Which statement is true regarding the sampling distribution of the sample mean? |
| |
Choose:
|
|
2. |
Which statement best illustrates the relationship between the term "parameter" and the term "statistic"?
Choose:
|
|
|
3. |
Which statement is NOT true regarding a sampling distribution of ALL possible samples of a given size? |
|
|
|
4. |
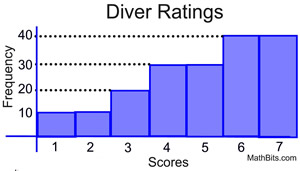
A study observed 3,150 high school divers and scored their performances on a scale from 1 to 7, with 7 being Olympic caliber.
The histogram shows the results of the study. |
|
| |
Which of the following would best describe the shape of the sampling distribution of sample means of all samples of size n = 50 from this population?
Choose:
|
|
5. |
Steven takes a series of samples of size n = 40 from a population of size N = 300. He examines the averages of the proportions in each of the samples. Steven could expect:
Choose:
|
|
6. |
A publication article states that a study showed that 85% of young adults, aged 16 to 21, use twitter. To verify these results, a research team conducts 500 surveys each containing 100 randomly chosen young adults, aged 16 to 21, and calculates the proportion,  , for each sample, pertaining to the use of twitter. |

|
| |
a) What is the expected mean of the sampling distribution of the sample proportions?
b) Using your result from part a, find the standard error of the sampling distribution of the sample proportions.
c) Describe the graph of the sampling distribution of the sample proportions.
d) If the sample size was increased to 5000, how would this affect the sampling distribution of the sample proportions?
|
|
7. |
Fifty iPads are drawn at random from a factory population of iPads, and the weight of each of the iPads is recorded. Three hundred draws of this same size occur. The factory's records show that iPads weigh 1.5 pounds with a standard deviation of 6.5 ounces. |

|
| |
a) What is the expected mean of the sampling distribution of the sample means?
b) Find the standard error of the sampling distribution of the sample means.
c) Describe the graph of the sampling distribution of the sample means.
d) If the sample size was increased from 50 to 100, how would this affect the sampling distribution of the sample means?
|
|
8. |
A sample data set shows the body temperatures of 200 dogs. A histogram is constructed to depict the shape of the distribution of this sample. Does the histogram show the shape of a sampling distribution of sample means? Explain why or why not.
|
|
|
9. |
A news magazine randomly surveys a sample of 500 voters. As a result of the survey, the magazine predicts that the Democratic candidate for the state Senate will get 45% of the vote. The candidate actually got 48% of the vote. Can it be concluded that the survey was done incorrectly? Explain.
|
|
|
10. |
A litter of 4 kittens has one male (Chewy) and three females (Ella, Minny and Olive). A study will determine the sexes of random samples of two kittens from the litter. Do not allow a sample such as {Olive,Olive}, and consider that {Ella, Minny} to be the same as {Minny, Ella}.
a) Identify the
different samples.
b) Find the proportion of females in each sample.
|
 |
| |
c) Find the mean of the sampling distribution of the sample proportions.
d) Is the mean of the sampling distribution of the sample proportions equal to the population proportion of females?
|
|

NOTE: The re-posting of materials (in part or whole) from this site to the Internet
is copyright violation
and is not considered "fair use" for educators. Please read the "Terms of Use". |
|