|
Check out the " Refresher" Sections relating to Regression Equations if you need to review. Regression analysis is used to study the relationship between pairs of variables of the form (x,y). The x-variable is the independent variable controlled by the researcher. The y-variable is the dependent variable and is the effect observed by the researcher. When this data is graphed, forming a scatter plot, an attempt is made to find an equation that "fits" the data. We know that this equation may, or may not, be linear (a straight line).
|
Regression analysis determines the relationship between values of x and observed values of y, from which the most probable value of y can be predicted for any value of x. |
|
The term "regression" is attributed to Sir Francis Galton (nineteenth century) as he described data as "regressing" toward the mean when studying relationships between the heights of parents and children. It is suggested that R. J. Adcock (of the same era) may have actually been the first to utilize linear regression. [Source: David Finney, Journal of Applied Statistics]

Note: The fact that a relationship may exist between two variables does not mean
that one variable is "causing" the effect on the other variable.

We have seen in past courses how the graphing calculator can perform a linear regression on a data set to find a linear model for the data (the line of best fit). Unfortunately, not all data lends itself to being represented linearly, as a linear regression. We will now be using the graphing calculator to also find non-linear regressions. This page will add the quadratic regression, exponential regression and power regression to our regression analysis procedures.
 |
 It may not always be obvious from looking at a scatter plot of the data which shape (curve) will be the best fit. Some situations may require more investigation before deciding upon a possible shape (curve), and some situations may not be modeled by any of these shapes (curves). It may not always be obvious from looking at a scatter plot of the data which shape (curve) will be the best fit. Some situations may require more investigation before deciding upon a possible shape (curve), and some situations may not be modeled by any of these shapes (curves). |
|
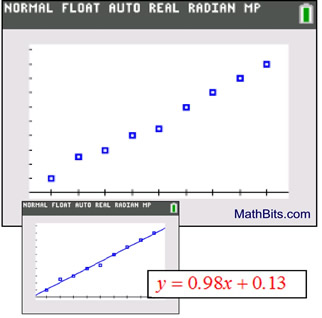
Let's take a quick look to refresh our memories about the Linear Regression.
Linear Regression (LinReg) |
|
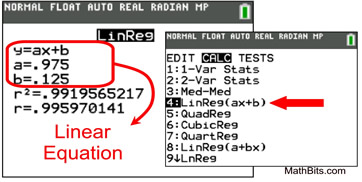 Characteristics:
• The scatter plot appears to be nearly a straight line with a positive slope (for this example) or negative slope.
• The residual plot would show a random pattern.
• Form: y = ax + b where a is the slope
• The linear regression equation will be used to predict y-values that lie within the plotted values (from x = 0 to x = 9) ( interpolate).
• The linear regression equation will be used to predict y-values that lie outside the plotted values (ex trapolate). (less reliable)
|
|
Note: On the TI-84+ graphing calculators,
a linear regression can be found using 4:LinReg(ax+b) or
8:LinReg(a+bx). Read about the difference at
"LinReg(ax + b) versus LinReg(a + bx)".

|
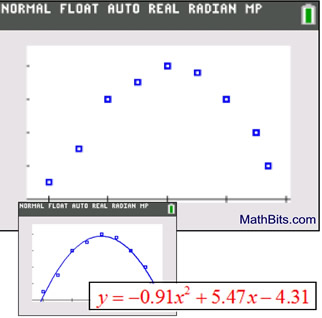
A Quadratic Regression produces a quadratic model, following the shape of a parabola, to represent the relationship of the data. The data shown below is obviously not linear. |
Quadratic Regression (QuadReg) |
|
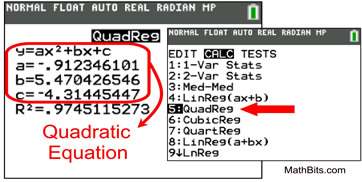 Characteristics: Characteristics:
• The scatter plot appears to resemble a parabola opening downward (for this example) or opening downward.
• The residual plot would show a pattern.
• Form: y = ax2 + bx + c (where a is not 0)
• The quadratic regression equation will be used to predict y-values that lie within the plotted values (from x = 0 to x = 5) (interpolate).
• The quadratic regression equation will be used to predict y-values that lie outside the plotted values (extrapolate). (less reliable)
|
|

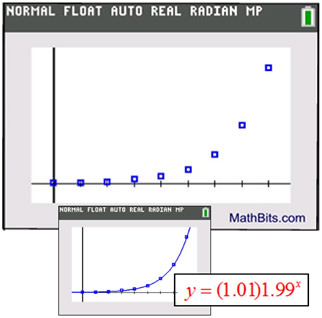
At first glance, you may think that the graph shown below resembles half of a parabola.
But the "leveling off" nature of the left hand side of the graph implies that this is more likely to be an exponential regression. You will have to look carefully to determine if a graph can be modeled by an exponential regression, since several different styles may take on this basic shape. |
Exponential Regression (ExpReg) |
|
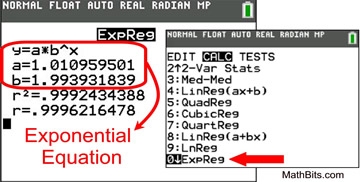
Characteristics:
• The scatter plot appears to resemble a rate of growth for this example (opening upward) or rate of decay (opening downward).
• The residual plot would show a pattern.
• Form: y = abx (where a is not 0)
• The exponential regression equation will be used to predict y-values that lie within the plotted values (from x = 0 to x = 8) (interpolate).
• The exponential regression equation will be used to predict y-values that lie outside the plotted values (extrapolate). (less reliable) |
|
|

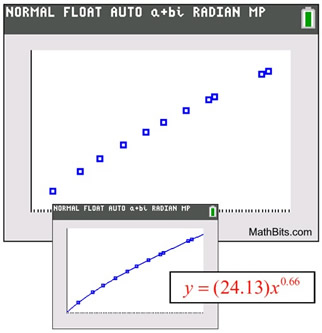
It may be particularly difficult to determine if a scatter plot is best represented with an exponential regression or a power regression. They are very similar in characteristics. |
Power Regression (PwrReg) |
|
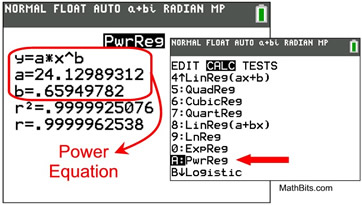
Characteristics:
• The scatter plot resembles that of an exponential function opening upward or downward (as in this example).
• Power regression will not allow an independent variable of 0.
• The residual plot would show a pattern.
• Form: y = axb (where x is not 0)
• The power regression equation will be used to predict y-values that lie within the plotted values of x (interpolate).
• The power regression equation will be used to predict y-values that lie outside the plotted values (extrapolate). (less reliable)
|
|
|
 If you are undecided as to which regression model would be best suited for your scatter plot, it will be necessary to investigate the possible choices a little more closely in relation to your data.
Consider the following example. References are made to the TI-84+ family of calculators.
| Situation: A rapidly growing bacteria has been discovered. Its growth rate is shown in the chart at the right. |
Hours Since Observation Began |
Number of Bacteria in the Sample |
0 |
20 |
1 |
40 |
2 |
75 |
3 |
150 |
4 |
297 |
5 |
510 |
|
|
| a) Prepare a scatter plot of the data with hours as the independent variable and the number of bacteria as the dependent variable. |
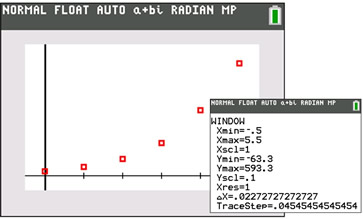 |
When preparing the scatter plot, use the ZOOM STAT option on the calculator to get a clear picture of the location of the data.
We can see a definite curving nature to the plot which implies a non-linear regression. |
| b) Determine which regression model best approximates this data and write the equation. |
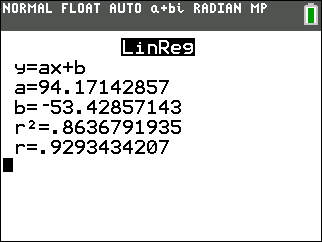
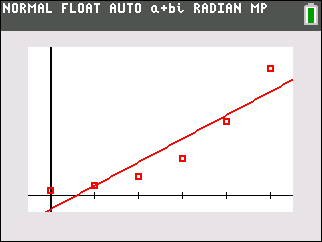
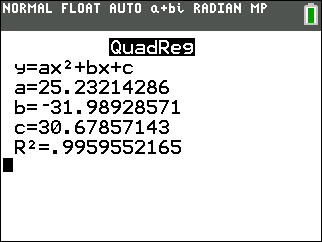
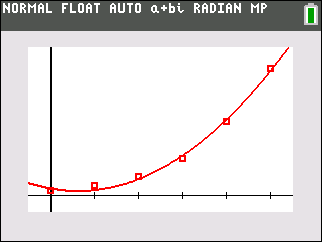
We have visually eliminated the linear regression because of the curving nature of the plot. That leaves us with three viable candidates: the quadratic, exponential and power regressions. It is difficult to choose between these three possibilities simply by looking at the graph, since the graphs of all three regressions can have similar characteristics.
Let's have the calculator show us how well each regression would "fit" the scatter plot.
|
|
Our visual assumption regarding the linear regression was correct. The linear regression equation is only hitting one of the scatter plots and its rate of change does not appear to be following the rate of change of the scatter plot.
|
|
|
The quadratic regression equation goes through several of the data points and it appears to be following the rate of change of the scatter plot. There is a bit of a disconnect in the lower left portion of the graph, as the quadratic regression is changing from decreasing to increasing.
|
|
|
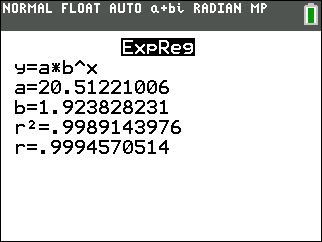
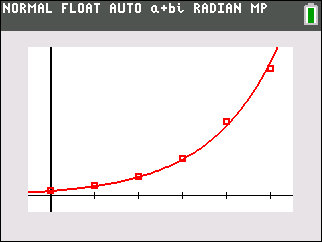
The exponential regression equation appears to be a good fit, as it passes through most of the plotted points and appears to follow the increasing rate of the data. Unlike the quadratic regression equation, the exponential regression equation is continually increasing.
|
|
|
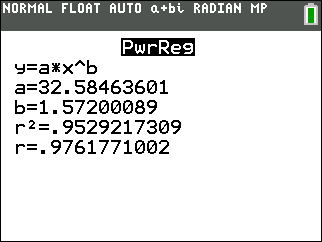
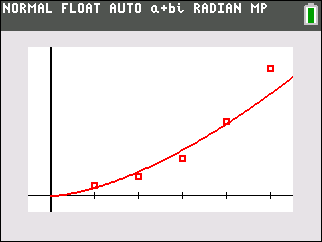
The power regression equation surprisingly hits only a few of the points and does not seem to follow the degree of increase as well as the exponential model. (Note: Power regressions on the calculator will not allow the independent variable to be zero. For this reason, the zero time and corresponding number of bacteria had to be eliminated from the data set for this plot.)
Of the four choices, the exponential regression will be the best choice in this situation. The graph passes through the most number of actual data points, the graph is continually increasing, and the graph is increasing at a rate similar to that of the scatter plot. This choice makes sense for this data, since exponential models are often used with population growth (even when the population is bacteria).
The exponential regression equation is  . .
 You may be tempted to find the best "fitting" model by looking for the highest correlation coefficient (r). This may not be the best method of choice. You may be tempted to find the best "fitting" model by looking for the highest correlation coefficient (r). This may not be the best method of choice.
Only linear based regression models should be compared in this manner, and even then you may not get the best fit. The linear based models are linear, exponential, power and logarithmic regressions. A best "fit" is found by careful examination of the graph, the manner in which the regression equation fits the graph, and how well the rate of change of the regression equation follows that of the data points for predictability. |
|
|
|
Keep in mind that when working with real world data, it is unlikely that any regression model is going to be a "perfect fit" (pass through all of your data points). Your goal is to find the model that fits as many of the the data points as possible and will be the best indicator of trends in the data. |

NOTE: The re-posting of materials (in part or whole) from this site to the Internet
is copyright violation
and is not considered "fair use" for educators. Please read the "Terms of Use". |
|
