
|
Variance measures how far a set of data is spread out. A variance of zero indicates that all of the data values are identical. All non-zero variances are positive. |
A small variance indicates that the data points tend to be very close to the mean, and to each other. A high variance indicates that the data points are very spread out from the mean, and from one another. Variance is the average of the squared distances from each point to the mean.
The process of finding the variance is very similar to finding the MAD, mean absolute deviation.
The only difference is the squaring of the distances.
Process: (1) Find the mean (average) of the set. (2) Subtract each data value from the mean to find its distance from the mean. (3) Square all distances. (4) Add all the squares of the distances. (4) Divide by the number of pieces of data (for population variance). |
One problem with the variance is that it does not have the same unit of measure as the original data. For example, original data containing lengths measured in feet has a variance measured in square feet.
|
Don't ROUND too soon! When working with the formulas for variance and standard deviation, be careful to avoid rounding too soon. If calculating by hand, always carry more decimal places within the calculations than is expected for the final result. If working with a calculator, carry the full value of the calculator entries until you arrive at the final result.
|
|


|
Standard deviation shows how much variation (dispersion, spread, scatter) from the mean exists. It represents a "typical" deviation from the mean. It is a popular measure of variability because it returns to the original units of measure of the data set. |
A low standard deviation indicates that the data points tend to be very close to the mean. A high standard deviation indicates that the data points are spread out over a large range of values.
The standard deviation can be thought of as a "standard" way of knowing what is normal (typical), what is very large, and what is very small in the data set.
Standard deviation is a popular measure of variability because it returns to the original units of measure of the data set. For example, original data containing lengths measured in feet has a standard deviation also measured in feet.
 To compute standard deviation by hand:
The standard deviation is simply the square root of the variance. To compute standard deviation by hand:
The standard deviation is simply the square root of the variance.
This description is for computing population standard deviation. If sample standard deviation is needed, divide by n - 1 instead of n.
Since standard deviation is the square root of the variance, we must first compute the variance. |
1. Find the mean. |
|
2. Subtract the mean from each data value and square each of these differences (the squared differences). |
|
3. Find the average of the squared differences (add them and divide by the count of the data values). This will be the variance. |
 variance
 |
4. Take the square root. This will be the population standard deviation. Round the answer according to the directions in the problem. |
 standard deviation
 |

 Normal Curve Normal Curve |
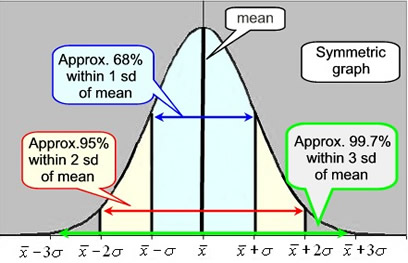
A normal curve is a symmetric, bell-shaped curve. The center of the graph is the mean, and the height and width of the graph are determined by the standard deviation. When the standard deviation is small, the curve will be tall and narrow in spread. When the standard deviation is large, the curve will be short and wide in spread. The mean and median have the same value in a normal curve.
Normal Curve Empirical Rule:
Approximately ...
• 68% of the data lie within one standard deviation of the mean.
• 95% of the data lies within two standard deviations of the mean.
• 99.7% of the data lies within three standard deviations of the mean.
IQR for a normal curve is 1.34896 x standard deviation. |
 |

|