|
Sinusoid: y = Asin(B(x - C)) + D
Of course, any graphing utility can produce an accurate graph of a sinusoid. But how do you accomplish this task if you must graph by hand? |
|
How to use your graphing calculator for graphing trig functions.
click here. |
|
|
Build a Sinusoidal Graph by hand:
y = Asin(B(x - C)) + D
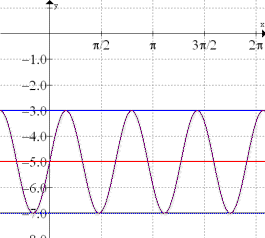
Graph: y = 2sin(π(x - 2)) - 5 |
Step |
Directions |
Graph |
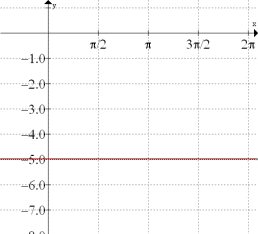
1. |
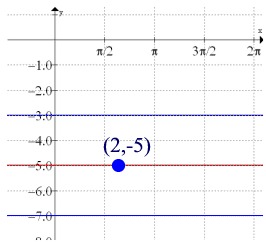
Draw the center line of the graph by graphing the horizontal line, y = D. |
|
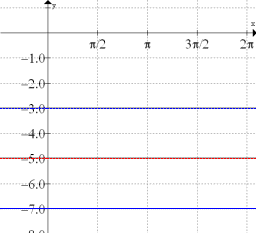
2. |
Using the amplitude, A, draw two horizontal lines, y = D + A and
y = D - A, that will encase the sinusoidal graph. The sinusoid's maxima (plural of maximum) will lie on y = D + A and its minima will lie on y = D - A. |
|
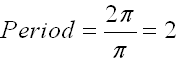
3. |
Determine the period of the curve using B. Period = 2π / B. Once we start to draw the graph, a complete cycle of the function will be completed within 2 units, for this example.
The horizontal distance between maxima and minima is ½ the period. |
|
4. |
Plot the point (C, D) which will lie on the center line. This point will be half way between a maximum point and a minimum point. |
|
5. |
Locate a maximum and minimum which are horizontally 1/4 of the period before and after the point (C, D). Since (2,-5) corresponds to (0,0) of the standard sine graph, y = sin x, the maximum point will be to the right of the point (2,-5).
y = 2sin(π(x - 2)) - 5
|
|

NOTE: The re-posting of materials (in part or whole) from this site to the Internet
is copyright violation
and is not considered "fair use" for educators. Please read the "Terms of Use". |
|