|
Graphs of trigonometric functions can be produced in degrees or in radians.
The graphs appearing here will be done in radians.
 |
When hand-drawing the graphs of sine and cosine, draw vertical dotted lines at  intervals to remind you of the connection to the four quadrants from the unit circle and to keep your graphs accurate.
(Such dotted lines will resemble the dashed vertical grid lines in the graphs below.)
|
The sine and cosine functions take on y-values between -1 and +1.
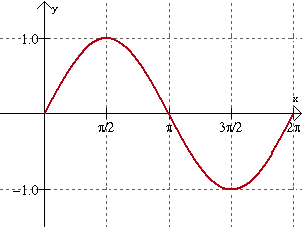
 Sine Function: y = sin x Sine Function: y = sin x |
|
y = sin x

|
• called a " wave" because of its rolling wave-like appearance (also referred to as oscillating)
• amplitude: 1 (height)
• period: 2 π (length of one cycle)
• frequency: 1cycle in 2 π radians [or 1/(2 π)]
• domain:  •
• range:  |
At x = 0, the sine wave is on the shoreline! (meaning the y-value is equal to zero)

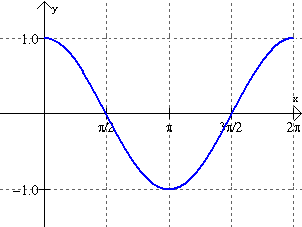
 Cosine Function: y = cos x Cosine Function: y = cos x |
|
y = cos x
 |
• called a " wave" because of its rolling wave-like
appearance
• amplitude: 1
• period: 2 π
• frequency: 1 cycle in 2 π radians [or 1/(2 π )]
• domain: 
• range:  |
At x = 0, the cosine wave breaks off the cliff! (meaning the y-value is equal to one)
Remember: The cosine curve is really the exact same graph as the sine curve shifted 90º, or π/2 radians, to the left!

|
How to use your graphing calculator for graphing trig functions.
click here. |
|

NOTE: The re-posting of materials (in part or whole) from this site to the Internet
is copyright violation
and is not considered "fair use" for educators. Please read the "Terms of Use". |
|


 intervals to remind you of the connection to the four quadrants from the unit circle and to keep your graphs accurate.


