|
The graphs of sine and cosine were investigated under Graphs of Sine and Cosine.
It is now time to investigate the remaining four trigonometric functions.
The graphs appearing here will be drawn in radians.
 |
When hand-drawing the trigonometric graphs, draw vertical dotted lines at  intervals to remind you of the connection to the four quadrants from the unit circle and to keep your graphs accurate.
(Such dotted lines will resemble the dashed vertical grid lines in the graphs below.)
|

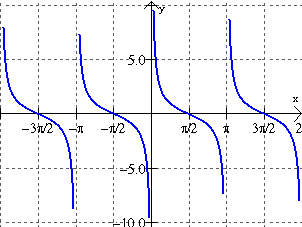
 Cotangent Function: y = cot x Cotangent Function: y = cot x |
|
y = cot x

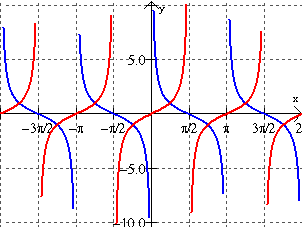
y = cot(x); y = tan(x)

|
• One cycle occurs between 0 and π.
• There are vertical asymptotes at each end of the cycle. The asymptote that occurs at π repeats every πunits.
• period: π
• amplitude: none, graphs go on forever in vertical directions
• The x-intercepts of the graph of y = tan(x) are the asymptotes of the graph of y = cot(x).
• The asymptotes of the graph of y = tan(x) are the
x-intercepts of the graph of y = cot(x).
• The graphs of y = tan(x) and y = cot(x) have the same x-values for y-values of 1 and -1.
Note: The graphs of y = tan(x) and y = cot(x) "face" in opposite directions.
|

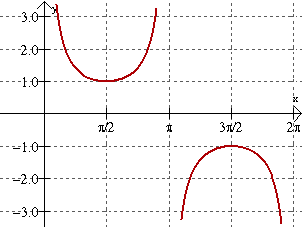
 Cosecant Function: y = csc x Cosecant Function: y = csc x |
|
y = csc x
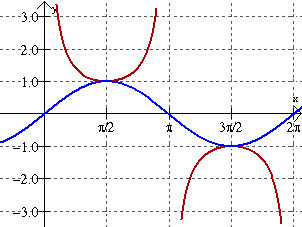
y = csc(x); y = sin(x)

|
• There are vertical asymptotes. The asymptote that occurs at π repeats every π units.
• period: 2π
• amplitude: none, graphs go on forever in vertical directions.
• The maximum values of y = sin x are minimum values of the positive sections of y = csc x. The minimum values of y = sin x are the maximum values of the negative sections of y = csc x.
• The x-intercepts of y = sin x are the asymptotes for
y = csc x.
Note: The U shapes of the cosecant graph are tangent to its reciprocal function, sine, at sine's max and min locations.
|


|
How to use your graphing calculator for graphing trig functions.
click here. |
|

NOTE: The re-posting of materials (in part or whole) from this site to the Internet
is copyright violation
and is not considered "fair use" for educators. Please read the "Terms of Use". |
|