|
|
A relation is simply a set of input and output values, represented in ordered pairs.
It is a relationship between sets of information. |
|
A relation can be any set of ordered pairs.
No special rules need apply to a "relation".
The following is an example of a relation:
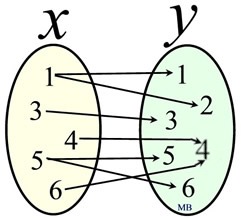
{(1,1),(1,2),(3,3),(4,4),(5,5),(5,6),(6,4)}
NOTICE: In a relation, points can be plotted one above the other on a graph. The ordered pairs can have the x-values repeated, such as (1,1) and (1,2). The red vertical dashed lines on the graph
show
where this happens.
|
 This graph is a "relation":
{(1,1),(1,2),(3,3),(4,4),(5,5),(5,6),(6,4)}
|
As seen above, a relation can be expressed in a graph,
and can be expressed in set notation: {(1,1),(1,2),(3,3),(4,4),(5,5),(5,6),(6,4)}
Relations can also be expressed
in a table:
x |
y |
1 |
1 |
1 |
2 |
3 |
3 |
4 |
4 |
5 |
5 |
5 |
6 |
6 |
4 |
|
Relations can also be expressed
in a mapping diagram:
 |

 |
Consider this example of a relation:
The relationship between eye color and student names.
(x,y) = (eye color, student's name)
Set A = {(green, Steve), (blue, Elaine), (brown, Kyle), (green, Marsha), (blue, Miranda), (brown, Dylan)}
Notice that the x-values (eye colors) get repeated. |
The graph we saw at the top of this page was a "scatter plot" which is comprised of a series of individual points, not connected.
A relation can also be a "connected" graph such as the graph shown at the right (a straight line).
This is the graph of y = x. Unlike the scatter plot, the x-values on this line have one (and only one) y-value associated with each of them.
If a vertical line is drawn on this graph, the line would only intersect the graph in ONE location, showing each x-value has only one y-value.
|
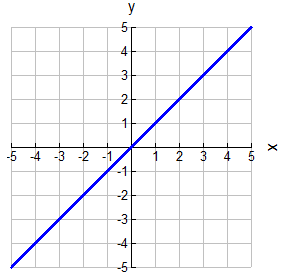 This graph is a "relation".
We will see in upcoming lessons that it is
a "special" type of relation (called a function).
|
It is also possible that a "connected graph" can have more than one y-value associated with the x-values.
The graph at the right is the graph of the square root of x, assuming only values of 0 or larger are used for x.
The red vertical dashed line on the graph shows that there are x-values for which there is more than one associated y-value.
 ; allows for points
such
as
(4, 2) and ; allows for points
such
as
(4, 2) and
(4,-2), or (2,1.424) and (2,-1.414) to exist.
|
 This graph is a "relation".
|
 |
The thing to remember about "relations" and graphs:
... a relation may have every x-value associated with only ONE y-value,
or
it may have some (or all) x-values associated with more than ONE y-value.
"
Relations are willing to choose one or more partners."
|
NOTE: The re-posting of materials (in part or whole) from this site to the Internet
is copyright violation
and is not considered "fair use" for educators. Please read the "Terms of Use". |
|
|