|
When interpreting graphs, take a good look at the graph before your start.
| Be sure you look for the following: |
| |
• Does the graph have a title? (such as "Books Sold", or "Distance Traveled"?)
Titles usually appear on graphs that represent real-world situations.
They give you a quick impression of what the graph will be about.
• How are the axes labeled? (such as time, distance, number of items, etc.)
Look at labels on both the horizontal and the vertical axes.
• What units are used to label the axes? (is distance in inches, feet, miles etc?)
Be careful! Questions about the graph may be using a different unit label. (i.e. yards)
• What scale is used on each axes? (1 tick mark = 1 mile or 1 tick = 10 miles)
Take particular notice if the scales are different on the two axes.
• What is the shape of the graph? (a line, a curve, parts of a line, dots?)
Most of our graphs will be straight lines, but not all of them. |
|
 Reading a Basic Math-Style Graph: Reading a Basic Math-Style Graph:
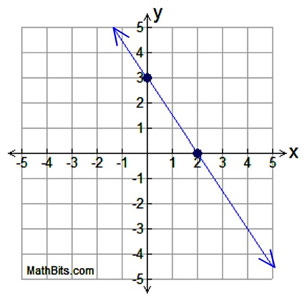 |
This is a basic math-style graph. It deals with a coordinate grid, a line, and a scale. There is no indication that this represents a real-world situation.
Look carefully at the scale.
(1 unit per tick mark on both axes)
Look at where the line crosses the y-axis. b = (0,3)
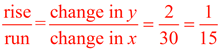
Look carefully at the slope of the line. m = -3/2
(rise over run)
The equation of the line: 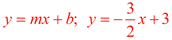 |

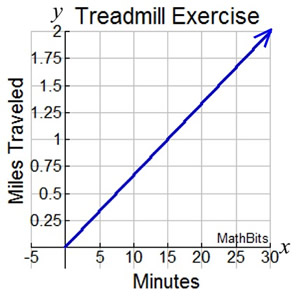
Reading a Graph that Models a Situation:

NOTE: The re-posting of materials (in part or whole) from this site to the Internet
is copyright violation
and is not considered "fair use" for educators. Please read the "Terms of Use". |
|