|
Directions: These questions pertain to working with and interpreting graphs.
1. |
|
|
The table above shows the coordinates for five points. The graph at the right shows the plot of the five points.
The points lie along a straight line. Which of the following equations can be the equation of the line passing through these points?
Choose:
|
|
2. |
The graph at the right shows the relationship between the number of chocolate chip cookies eaten and the number of calories from those cookies.
a) If the serving size = 3 cookies, how many calories are in one serving size?
Choose:
|
|
|
b) To the nearest tenth of a calorie, how many calories would be consumed from eating 10 cookies?
Choose:
|
|
3.
|
A book store has decided to sell Jason's Graphic Novel. The novel will be sold for $10 a copy. Which of the following graphs represents the sales of Jason's Graphic Novel? |
|
|
4. |
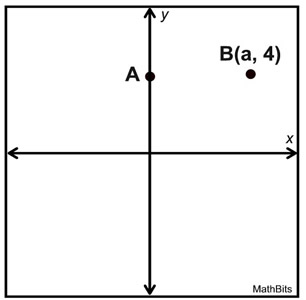
The graph shows point A on the y-axis and point B(a,4). Point A has the same y-coordinate as point B.
Point C is graphed at C(a,-6). The distance from point B to C is twice the distance from point A to point B.
a) What is the distance from point B to point C?
Choose:
|
 |
| |
b) What is the value of a in the point B(a,4)?
Choose:
|
| |
c) What would be the slope of a segment from A to C?
Choose:
|
|
5. |
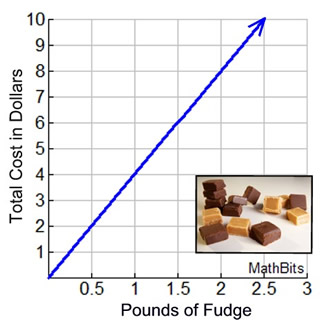
A booth at the State Fair is selling home-made fudge. The relationship between the pounds of the fudge sold and the total cost is shown in the graph at the right.
Which of the following statements about the graph are true?
(Choose all that apply and hit SUBMIT!) |
 |
| |
|
|
6.
|
Which equation has a constant of proportionality equal to 5? |
|
|
7. |
Which graph of the following equations will have the same y-intercept as the graph at the right?
|
|
|
8. |
Which equation expresses the relationship between x and y, as shown in the table at the right?
|
|
| |
|
|
9. |
Which of the relationships shown in the graphs and tables below have the same constant of proportionality between y and x as the constant of proportionality in the equation y = ½ x?
(Choose all that apply and hit SUBMIT!) |
| |
|
|
10. |
Sandi decides to make Valentine's Day cards for her friends and family. The table shows the dollars she spends in terms of the number of cards she makes.
a) Which equation represents the data in the table if x = number of cards and y = total cost?
|
|
| |
|
|
b) What does the slope of the equation represent?
Choose:
|
| |
c) What does the y-intercept of the equation represent?
Choose:
|
|

NOTE: The re-posting of materials (in part or whole) from this site to the Internet
is copyright violation
and is not considered "fair use" for educators. Please read the "Terms of Use". |
|