|
Directions: These questions pertain to story graphs.. Choose the best answers.
1. |
Which story could match the
graph shown at the right?
|
|
| |
Choose:
|
|
2. |
The graph at the right shows Dylan's motorcycle trip from his home to his friend's home in another city. |
|
a) During which time interval did Dylan stop for lunch?
Choose:
|
b) During which time interval did Dylan maintain the fastest average speed?
Choose:
|
c) What was Dylan's average speed between hour 3 and hour 5?
Choose:
|
|
3. |
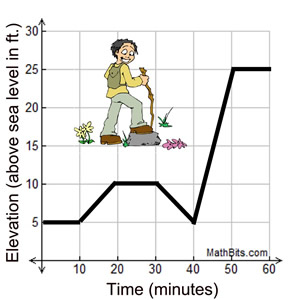
It takes Ariel 60 minutes to reach the hiking team's campsite, following a trail depicted in the graph at the right. |
 |
a) During which time interval was Ariel hiking downhill?
Choose:
|
b) What was the vertical height of the longest hill climbed by Ariel during this hike?
Choose:
|
|
c) What is the change in the elevation between Ariel's starting point and the campsite?
Choose:
|
|
4. |
Lynn has a hairstyle with bangs (a fringe of hair cut straight across her forehead). Lynn usually has her bangs trimmed every three months. The graph at the right shows the growth of her bangs over the past year. |
|
a) To what length, in inches, does Lynn have her bangs trimmed each time they are cut?
Choose:
|
b) During which month did Lynn miss the normal trimming of her bangs?
Choose:
|
c) At what constant rate were her bangs growing?
Choose:
|
|
5.
|
Which graph could represent the following story?
"Alison walked from her school's Commons area to her Math class. After class, she walked back to the Commons area, stopping to get a candy bar from a vending machine on the way." |
Choose:
|
|
6. |
Alan has embarked on a new exercise program on his new treadmill. The graph at the right shows his heart rate during one of his daily 40 minute workouts. |
|
a) What is the length of Alan warm-up?
Choose:
|
b) For how many minutes did Alan maintain a constant heart rate?
Choose:
|
c) At what rate was Alan's heart rate decreasing during his cool down?
Choose:
|
|
7. |
Ellen takes her dog, Gus, for a 30-minute walk as shown in the graph at the right.
Assume all walking sections are at a constant speed. |
|
a) How many city blocks did they cover in their walk?
Choose:
b) They walked faster in the last 12 minutes than in the first 6 minutes.
Choose:
|
c) Which of the following stories best explains the walk?
Choose:
|
|
8. |
Two graphs are shown below. The story associated with these graphs is "Oscar going to the movies and returning home". The problem is that there are no labeled scales on these graphs.
|
a) Which scale labels would fit Graph A?
Choose:
|
b) Which scale labels would fit Graph B?
Choose:
|
|
9. |
Sheldon rides his bike on a Saturday to complete his errands throughout the day.
He starts and ends his journey at his home.
Each line segment of the graph is referred to by the letters A through G.
|
|
| |
a) During which section of his day is he traveling at the fastest speed on his bike?
Choose:
|
b) If Sheldon spent 2 hours at the pet store, which section of the graph represents this stop?
Choose:
|
c) What was the farthest distance, in miles, that Sheldon was from home during the day?
Choose:
|
d) How many miles in total did Sheldon travel during this journey?
Choose:
|
e) How many times did Sheldon stop during this journey?
Choose:
|
f) If Sheldon was 2 miles from home while he as eating at McDonald's, which section of the graph represents this stop?
Choose:
|
|
10. |
Which story could match the
graph shown at the right?
|
|
| |
Choose:
|
|

NOTE: The re-posting of materials (in part or whole) from this site to the Internet
is copyright violation
and is not considered "fair use" for educators. Please read the "Terms of Use". |
|