|
Directions: Read each problem carefully!
1. |
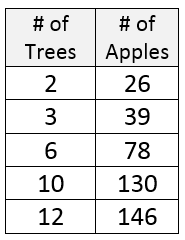
Does the table shown at the right demonstrate a proportional relationship?
Explain.
|
|
|
|
2. |
The perimeter of a regular pentagon can be represented by the equation P = 5s, where P is the perimeter and s is the length of a side.
Does this equation represent a proportional relationship?
Explain. |

In a regular pentagon,
all of the sides are
of the same length.
|
Choose:
|
|
3. |
Does the table shown at the right demonstrate a proportional relationship?
Explain. |
|
|
|
4. |
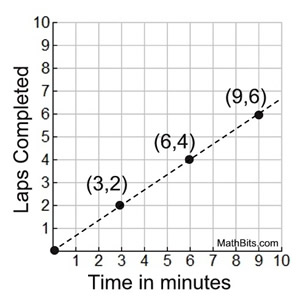
Examine the graph at the right.
a) Explain why this graph displays a proportional relationship? |
|
| |
b) If r = unit rate, explain the meaning of (1, r). |
| |
c) What is the constant of proportionality? |
| |
|
|
5. |
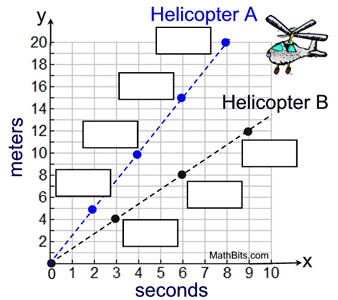
Two model helicopters take off at the same time. Helicopter A rises 5 meters every 2 seconds. Helicopter B rises 4 meters every 3 seconds.
a) Fill in the missing ordered pairs on the coordinate graph at the right for each helicopter.
|
 |
| |
b) Does the rise of each helicopter represent a proportional relationship? Explain.
|
| |
c) Using ratios, explain why helicopter A is rising faster than helicopter B.
|
| |
d) State the constant of proportionality associated with the rise of each helicopter.
|
|
6. |
Carley ordered 10 bottles of WaZo Colored Hair Spray for $50.60. Which of the following equations represents the proportional relationship between y, the total cost of the hair spray and x, the number of bottles ordered? |
 |
|
|
|
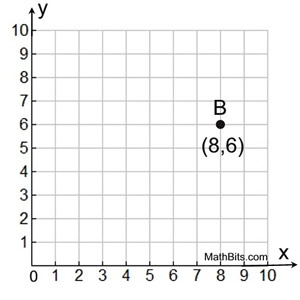
A line passing through unknown point A and plotted point B represents a proportional relationship.
If point B lies at (8,6), which of the ordered pairs shown below, could represent the coordinates of point A?
Choose:
|
 |
|
8. |
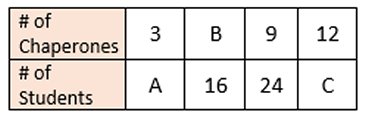
The number of chaperons on a field trip is proportional to the number of students, as shown in the table at the right. |
 |
| |
Which of the following choices represents the values for A, B and C, in that order?
Choose:
|
|
9. |
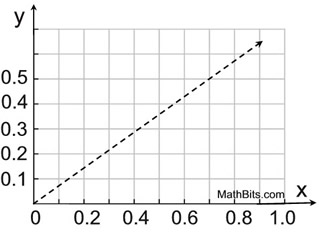
The graph at the right shows the relationship between x-values and y-values in a given situation. Which of the following choices is the constant of proportionality for this graph?
Choose:
|
|
|
10. |
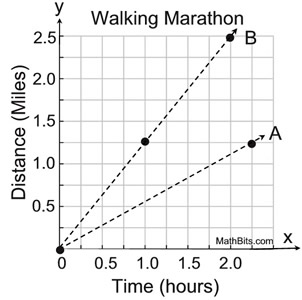
Which of the following choices represents the constant of proportionality associated with walkers A and B, in that order?
(Dots indicate locations of grid intersections.)
|
|
|
|

NOTE: The re-posting of materials (in part or whole) from this site to the Internet
is copyright violation
and is not considered "fair use" for educators. Please read the "Terms of Use". |
|
|