 The key word is "equivalent (equal)" ratios.
 |
|
3 Ways to Determine if Proportional Relationships Exist:
Verify that a given proportion is TRUE:
To determine if a simple given proportion is true, look at the fractions.
If these ratios (fractions) both reduce to the same value, the proportion is true.
Double check: the "cross multiply" of 12 • 9 = 4 • 27 is true. |
 This is a TRUE proportion because
both fractions reduce to 1/3.
(and because 12 • 9 = 4 • 27).
|
Does the data displayed in a table show a proportional relationship?
First, remember that not ALL tables will display a proportional relationship.
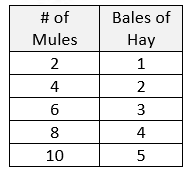
To determine if a proportional relationship exists, you need to look for equivalent (equal) ratios within the table. Hopefully your table will be relatively small, as ALL values within the table will need to be checked.
All of the entries in the table at the right will create equal ratios.

(# of mules per bale of hay = 2 : 1) |
Single Feedings

 (Bales of hay per # of mules = 1 : 2)
|
| Hint: You could plot the points from a table onto a coordinate grid to see if you have a proportional relationship. See graph information as it pertains to proportional relationships in the section below. |
More about Constant of Proportionality:
• It is a positive number.
• It is also called the unit rate. (Find the y-value when x = 1.)
• It is what you multiply times x to get y.
• It is typically represented by the letter k. (y = kx or y/x = k) |
Observing Proportionality on Coordinate Graphs:
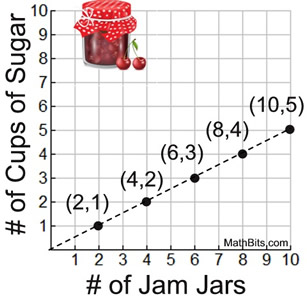
On the graph at the right, each (x,y) coordinate indicates the number of jars of jam and the number of cups of sugar needed to produce that number of jars of jam.
(#JamJars, #CupsSugarNeeded)
The (0,0) coordinate establishes the fact that if there were no jars, there was no sugar needed.
The coordinate (1,½) establishes the unit rate  . .
The unit rate shows that the constant of proportionality for this graph is ½.
y = ½ x
|
 This graph demonstrates a proportional
relationship because it is a straight line
passing through the origin. |

|
|
Does the table shown at the right represent a proportional relationship?
Explain. |
|
Solution:  TRUE! Since all of the ratios are equivalent, this table is a proportional relationship. The constant of proportionality is 3. TRUE! Since all of the ratios are equivalent, this table is a proportional relationship. The constant of proportionality is 3. |
|
Does the table shown at the right represent a proportional relationship?
Explain. |
|
Solution:  Since all of the ratios are NOT equivalent, this table is NOT proportional relationship. Since all of the ratios are NOT equivalent, this table is NOT proportional relationship. |

|
The circumference of a circle is proportional to its diameter and is represented by the equation  . What is the constant of proportionality? What does it tell you about this relationship? . What is the constant of proportionality? What does it tell you about this relationship?
|
| Solution: The constant of proportionality is π. [y = kx where k is the constant of proportionality]. It tells you that the unit rate is 3/1 and that the ratio of C/d will always be the same (constant) and will be π. |
|
|
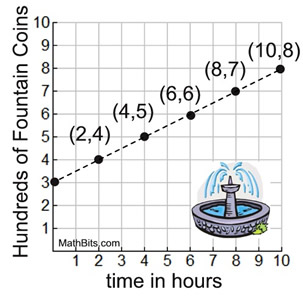
Does the graph shown at the right represent a proportional relationship? Explain. |
 |
Solution: 
Since none of these ratios are equal to one another (and certainly not ALL equal to each other), this graph does not display a proportional relationship.
While the graph is a straight line, it does NOT pass through the origin. |
|