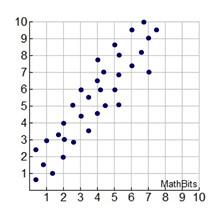
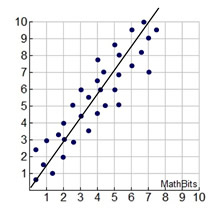
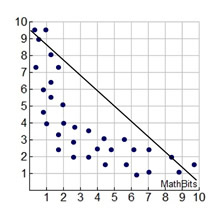
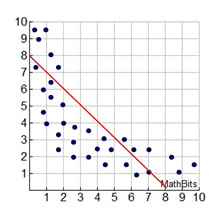
We have seen how data can often be represented by a stratight line (linear association).
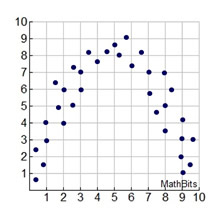
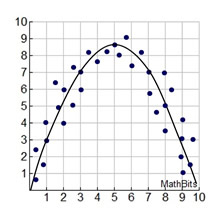
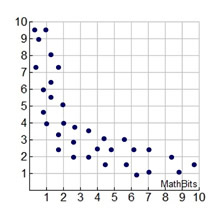
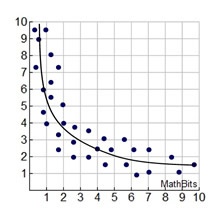
Sometimes, however, a "straight line" is not the best shape to represent the data. There are actually, different types of "curves" that can be used to model data, referred to as non-linear associations.
Some situations may require more investigation before deciding upon a possible shape (curve), and some situations may not be modeled by any specific shapes (curves). Finding a "line of best fit" by hand is possible, but finding a "curve of best fit" is much more difficult. So, it upcoming courses, we will call for help from our graphing calculator to assist with "curves of best fit".
Topical Outline | JrMath Outline | MathBitsNotebook.com | MathBits' Teacher Resources
|