|
Directions: Read carefully.
1. |
| The 4-legged Market sells everything relating to dogs, cats and horses. The store offers weekly specials, and wants to estimate the percentage of their customers who buy the specials. A random sample of 150 customers who buy horse feed over a 6 month period was used. It was found that 30% of these customers bought weekly special items. Which statement about the sample group is true? |
 |
|
|
2. |
The heights (in inches) of the students in two Scouting Troops were surveyed.
Troop A: 60, 65, 64, 68, 66, 63, 64, 68, 67, 62
Troop B: 67, 69, 62, 60, 61,
64, 63, 65, 65, 61
Which of the following statements is true?
|
|
| |
Choose:
|
|
3. |
Student Council is trying to decide upon a theme for the spring dance. They have narrowed the choices to four options and are going to survey the 8th grade class.
Which method would produce the best representative sample? |
|
Choose:
|
|
4. |
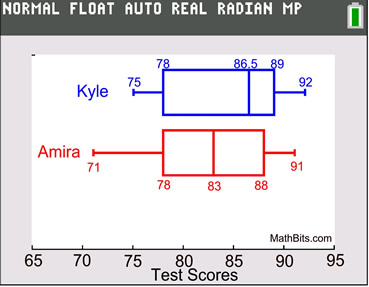
The box and whisker plots at the right, show the semester test scores in History class for students Kyle and Amira.
Which conclusion can be drawn from these box plots?
|
Exam Scores for History Class
 |
| |
Choose:
|
|
5. |
In gym class, groups of 12 students are given a designated amount of time to complete as many sit-ups as possible. A goal of 55 sit-ups is desired. The number of sit-ups completed in the given amount of time are shown in the following dot plots.

Which of the following statements regarding the sit-ups is NOT true? |
| |
Choose:
|
|
6. |
The number of iTunes downloaded by 25 students in one week ranges from 15 to 55. The box-and-whisker plot depicts this data.

For this data:
a) What is the minimum number of iTunes downloaded?
Choose:
b) What is the maximum number of iTunes downloaded?
Choose:
c) What number represents the first quartile of this data?
Choose:
d) What number represents the median of this data?
Choose:
e) What number represents the third quartile of this data?
Choose:
|
|
7. |
The charts below show data on the number of ceritfied trainers belonging to two fitness gyms. The ages and salaries of the trainers were collected.
Which of the following statements is true regarding this data?
Choose:
|
|
8. |
A college math class posts test scores (using student social security numbers). All of the students taking the test scored over 70% correct. Unfortunately, 5 students were absent for the test and the computer listed their scores as 0 until the test is taken. Assuming that no score repeated more times than the 0's, what measure of central tendency would most likely give the best representation of this data at this time?
Choose:
|
|
9. |
The data set 15, 18, 19, 20, 21, 21, 21, 22, 24, 26, 27, 27, 28, 29, 30 represents the number of hours students from Mr. Allen's math class spent on their cell phones during a 5-day school week.
Which box-and-whisker plot represents this data?
Choose:
|
|
10. |
A survey was conducted of 150 randomly selected students asking:
"Which social media do you check first at the end of a school day?".
The results are shown below:
TikTok |
Facebook |
YouTube |
Instagram |
35 |
37 |
48 |
30 MathBits |
The results of this survey are used to make a generalization regarding all of the 650 students in the school building. Based upon this survey, what would be the number of students in the building who first check YouTube at the end of the school day?
Choose:
|
|
11. |
Cars were recorded as they passed through a 55 mph speed trap during the morning and the afternoon in a small town. The first fifteen cars in each time study are shown below.

Which of the following statements is true regarding this data?
Choose:
|
|

NOTE: The re-posting of materials (in part or whole) from this site to the Internet
is copyright violation
and is not considered "fair use" for educators. Please read the "Terms of Use". |
|